Most Common Majors
- Biology
- Biochemistry
- Chemistry
Around 70% have a bachelor's degree
Most students choose a major in science because the prerequisites often overlap with the required courses for science majors.
Every year the College of Pharmacy has students from around 20 different majors. Students in the program have backgrounds in communication, business, theater, history and more, so pick the best option for you!
Experience
The average amount of paid work experience in pharmacy or health care for students starting the PharmD program is about 18 months, full or part-time.
If you are not able to get any work experience in pharmacy or health care, be sure to have volunteer, job shadowing or informational interview experiences as an alternative. It’s also very common for applicants to have many different work experiences outside of pharmacy or health care to develop different professional skills.
Class Size
The class size each year is approximately 100 to 140 students, with about 20-40 students in Duluth and 80-100 in the Twin Cities.
Fall 2023 Incoming Class Stats
GPA
3.49 Average PharmCAS GPA
3.36 Average Science GPA
2.54-4.0 GPA Range
The PharmCAS GPA includes all college courses you have taken, including original and repeated grades. GPA is just one part of an applicant's academic achievement.
Demographics
Average Age: 23
Age Range: 19-44
Female / Male Ratio: 71%/ 29%
MN Residents: 65%
WI Residents: 10%
Out of State Students (Non-MN/WI): 19%
International/Non US Citizens: 6%
Identify as a member of a population that is underrepresented in the PharmD program: 7%
When reviewing these statistics, it is important to keep in mind that the admissions committee considers our selection criteria using a holistic process. Academic achievement includes many factors; applicants who have been admitted with a low GPA have typically demonstrated strong academic potential in other areas of their academic background.
Quality Indicators
On-time Graduation Rates
2020: 94%
2021: 93%
2022: 83%
2023: 91%
2024: 84%
Class of 2023 Post-graduation Placement Rate
97% Placement rate (6 months)
31% Pharmacy employment
54% Residency
3.5% Fellowship or graduation education
0% Non pharmacy/other pursuits
0% Still seeking
3% Not yet seeking (intentionally delayed search)
8.5% No response to survey
Match Rates
2020: 78%
2021: 72%
2022: 88%
2023: 91%
2024: 91%
Curious what our graduates are doing?
NAPLEX First Time Candidates Passing Rate
2023: 79%
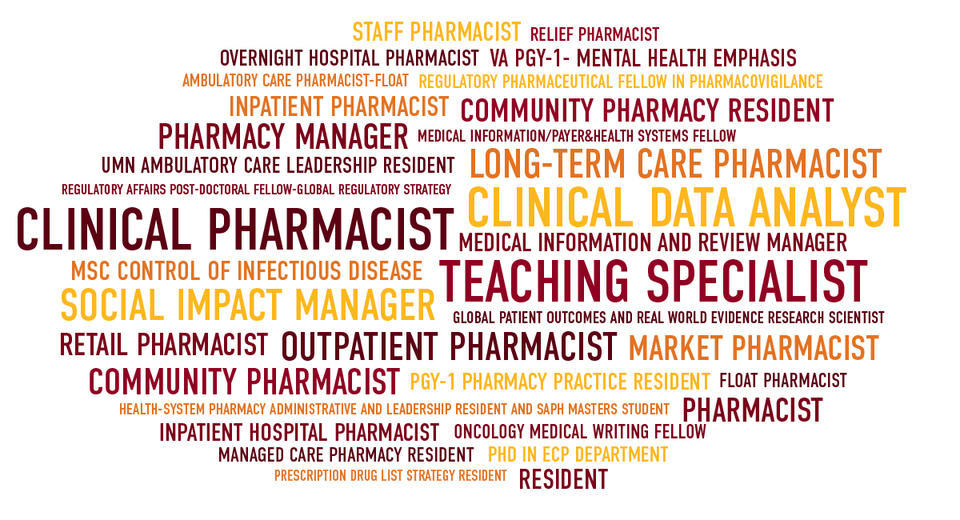
Current Graduate Job Titles
